During the long era of zero and negative interest rates in Europe and most of the Nordic countries, some allocators seemed to be reluctant participants in private credit. With some liquid government, corporate and mortgage backed paper – and bank deposits – offering negative yields, they were forced to invest in less liquid credit simply to meet their minimum return targets.
Now that interest rates and credit spreads have started to revert to more historically normal levels, allocators have a choice between more traditional credit and alternative or private credit. They are continuing to allocate to alternative and private credit, and in many cases are increasing allocations.
The motivations are both to reduce risk through collateral, structuring and covenants, and also to increase returns, both due to higher rates and spreads on lending and sometimes through special opportunities in mainly stressed and distressed. Allocators also recognize that private credit adds portfolio diversification benefits as it is not perfectly correlated to public credit (even if that is partly because it is valued less frequently).
Acknowledgments
“We are proud to present this report on Alternative Credit, which compiles answers from investors across the Nordics. The responses we have received provide valuable insight into how Nordic investors approach this broad, and growing, asset class and we would like to thank all the investors that have participated. We would also like to thank the team at Aegon Asset Management who have provided us with support for this project.”
– Jonas Wäingelin, Editor in Chief, NordicInvestor
“Aegon AM would like to share insights in the Nordic market by sponsoring a Nordic investor survey for the second time. The outcome shows that the leading Nordic players are near to our heart with regards to responsible investing, interest in new solutions for institutional investors but also engaging and exchanging ideas. We hope you enjoy this outcome report and are open for any feedback or questions you might have”
– Frank Drukker, & Jeroen van Wilgenburg, Aegon Asset Management
NordicInvestor has interviewed allocators who specialize in alternative and private credit in Sweden, Denmark, Norway, Finland and Iceland. They work for pension funds, insurance companies, banks, family offices and consultants. Many of the firms have been allocating to private debt for at least 10 or 15 years. Together these investors manage alternative credit portfolios over 20 billion euro. This report covers the assets allocated to alternative and private credit. It does not cover all assets of the firms.

All investors who can handle illiquidity should have a strategic allocation to private debt to improve risk-adjusted returns
A list of those participating with attribution appears below (some other companies that also participated anonymously feed into our general conclusions, but we have not quoted them).
1. Executive Summary
Yield pickup, diversification, and exposure to rising interest rates, are the top three return attractions of private debt. On the risk side, lower loan to value ratios and more creditor friendly structures and documents are appealing, as is potential for faster and simpler restructurings and workouts. The asset class also offers some degree of diversification and might benefit from inflation.
Most allocators are maintaining or increasing broadly defined direct lending, but they may focus on different sub-sectors such as mid-market or non-sponsored deals. Many are also increasing opportunistic strategies such as distressed and special situations to take advantage of corporate refinancing and defaults and to target higher returns. Some are dialling down risk and emphasizing more senior, less leveraged or less cyclical deals to reduce default risks.
Return targets can range from mid single digit for plain vanilla low risk direct lending to mid teens for some opportunistic strategies.
Yield pickup targets for private debt relative to public debt range from 100 to 600 basis points, and structured credit also offers comparable pickups in late 2022. The extra yield can be a reward or premium for one or more of illiquidity, complexity, sourcing, structuring, and speed of execution.
Cash within alternative and private credit allocation is generally managed conservatively, in bank accounts or government paper. There is little appetite for yield enhancement on cash within these allocations.
All allocators are aware of secondary markets in funds and individual private loans, but so far only a handful have used them.
Allocators are aware of recession and default risks, even if they have not yet noticed any problems in 2022. Some have moved towards more senior paper and less cyclical sectors. Others are anyway confident that seasoned private credit managers will be able to manage defaults, workouts and recoveries.
Allocators have often developed their own ESG criteria and questionnaires. The availability and consistency of data reporting from private debt managers remains a concern.
Most allocators are happy with SFDR 6 or 8 for the time being. Many expect SFDR 8 will become standard over time, at least for direct lending if not opportunistic strategies.
It can be more difficult to find SFDR 9 funds to pursue impact investing and given that the rules are at an early stage it is not essential to have the SFDR 9 label for an impact strategy.
Some allocators argue that impact investing should be done in a separate vehicle. Others claim that some impact features, such as sustainability linked ratchets, are already becoming standard for European direct loans.
Due diligence is mainly done in house, except for tax and legal advice. DD focuses mainly on existing managers, but there is also some appetite for newer managers who have survived some crises and who have team longevity.
Most allocators use closed end funds with multi-year lockups. Though a few are embracing evergreen, open- ended funds or hybrid funds, they are sensitive to liquidity mismatch and cash drag effecting performance.
Some of the larger allocators are looking for funds running at least a billion, but some smaller and medium sized allocators will invest in funds running tens of millions. A handful of those writing larger tickets will invest in separately managed accounts as well.
Some allocators avoid offshore domiciles, due to tax perceptions and/or EU lists, but many invest in a variety of onshore and offshore domiciles.
2. Reasons for Allocations
Yield pickup fluctuated in 2022
All allocators are seeking some yield pickup from alternative and private credit, though the size of the pickup temporarily declined in 2022 because yields on publicly listed debt have increased more than on private debt. The pickup comparison is however a moving target: the interest rate hikes in the second half of 2022 have quickly flowed through to private debt yields.
Floating interest rate exposure attractive in 2022
The floating rate nature of private debt is appealing in a rising interest rate climate: investors expect that further rises in rates will filter through to private debt yields, which are usually referenced to a floating rate benchmark such as EURIBOR, LIBOR, SOFR or Prime Rate.
It is not entirely fair to compare 2022 and 2021 yields however, because loans originated in 2022 are sometimes lower risk

the quality of underwriting is improving which makes it harder to compare to the levels we saw last year
Risk mitigation sought through collateral, structuring and covenants
Risk mitigation is indeed another attraction, in terms of structuring, collateral backing, and covenants, which are usually stronger in private than public credit markets, especially in 2022 when it is more difficult to borrow or refinance in public markets, which have sometimes been described as effectively closed.

There are opportunities to tighten up covenants, and increase ownership
Diversification
Alternative and private debt offers diversification relative to conventional asset classes such as bonds and equities.
There is also considerable scope for diversification within alternative and private credit allocations.

We use different building blocks to construct a portfolio with higher, medium and lower risk elements. The lower risk part is mainly about yield and the higher risk opportunistic part also seeks capital appreciation. We do not want to be too concentrated in one issue, deal, sector, country or geography
Inflation protection
Though private debt does not offer explicit inflation protection, it may offer some implicit protection since central banks are raising rates in response to inflation and several allocators identify this as a reason to invest.
Another argument is that when lending against real assets, such as real estate or infrastructure, the collateral coverage ratios could improve in an inflationary climate. This is however debatable, since if inflation brings higher interest rates, that can also lead to lower valuations as seen in residential property in many countries in 2022.
Expedited restructuring and workouts
There is also a perception that if there are defaults, workouts and restructuring will be quicker and easier for a bilateral direct lending deal that has only two parties, as compared with more complicated public debt structures with multiple categories of creditors and other parties to coordinate.
the bilateral lenders who have structured documents appropriately can also be well positioned to swiftly restructure loans in a straightforward conversation without additional lenders and just one main owner in the company, and without the complication of dealing with multiple groups of creditors and shareholders
Duration and liability matching and Solvency II
Duration and liability matching and Solvency II were not high priorities for the manager selection allocators we interviewed, though in some cases they may be handled at firm level by different people or departments. There can be different opinions over the Solvency II treatment:
“The Solvency II accounting treatment for private debt is also quite favourable, though for us, optimizing risk adjusted returns rather than Solvency II is the priority,” – Jussi Tanninen, Head of Private Debt and Real Estate at Mandatum Asset Management
3. Changes in Allocations and Sub-Sectors
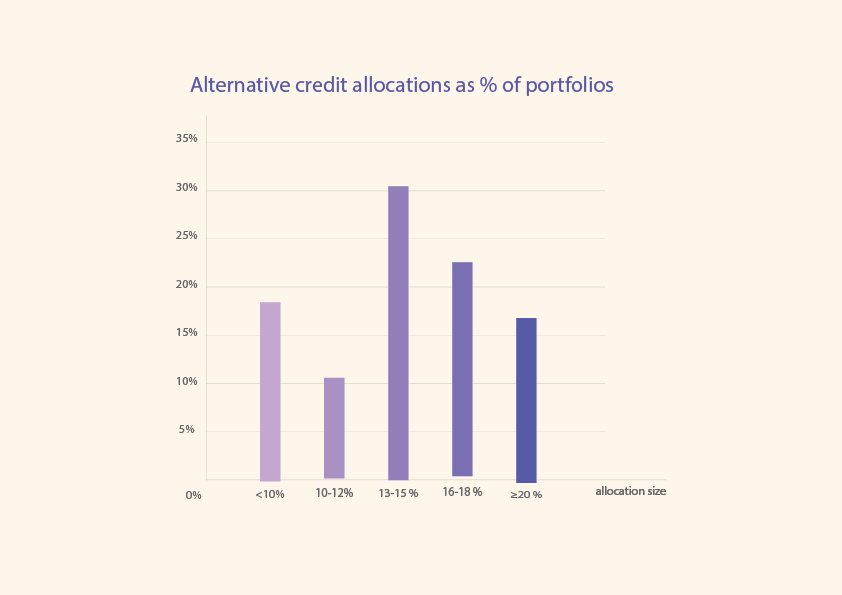
Nordic allocators have for many years been advancing beyond the classic 60% equities, 40% bonds, model and are embracing alternative credit. Alternative credit, including private credit, is most often a mid-teens allocation but the highest weights can be over 30%
“Private debt” and “direct lending” are sometimes used interchangeably, but private debt is a broader term. Whereas direct lending is usually a bilateral deal with one lender and one borrower, private debt could include private syndications and structures with multiple borrowers and lenders.
It is most common for Private credit to represent around half of alternative credit allocations but the range is wide. One reason is that some of allocators interviewed have only started their private credit programmes in the past few years. In many cases these allocations will also grow over time.
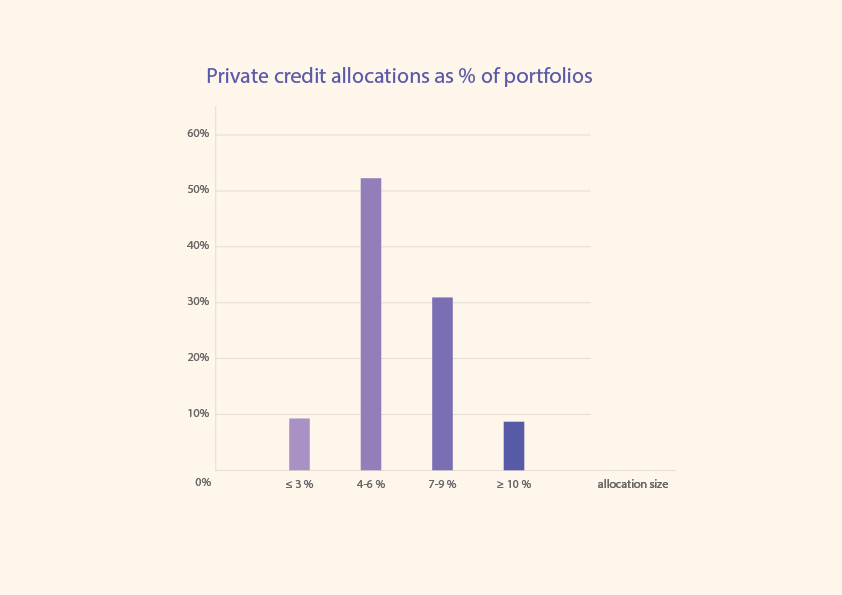
One investor, AP2, have completely substituted their listed alternative credit portfolio for private credit. Of the firms we have interviewed, private debt target allocations range from 2% (AP2) on the low end to 12% (Ericsson Pension) on the high end.
These are generally stable, core strategic allocations, though within the allocation there can be some tactical moves depending on the economic and financial market climate. In a normal climate, direct lending is favoured for steady and predictable returns but when there is more risk of recession, and consumer or corporate defaults, allocators are prepared to take more risk in search of higher returns from opportunistic strategies including stressed and distressed debt.
Most allocators maintaining or increasing direct lending
The majority of allocators interviewed are maintaining stable allocations to direct lending, or increasing it. Several are also adding to specialty finance and asset-backed lending (ABL). ABL generally includes lending against property, plant and equipment, though occasionally some forms of intangible assets may also be acceptable.
Some allocators highlight direct lending as being exceptionally attractive:

we have enough dry powder to take advantage of the best opportunities in a decade in terms of risk/return profile in the traditional direct lending market
Direct lending is itself a broad strategy with different segments, and two key variables for allocators to decide on are the size of borrowers, and whether borrowers are associated with private equity sponsors.

The focus is on the middle-market due to moderate leverage and better financial covenants compared to the broadly syndicated market
It often emphasises private equity sponsored companies. The key areas are middle-market direct lending to companies in the US and Europe. With private equity having a 10-year head start on direct lending, there are simply more companies out there which are backed by private equity firms.
There is an active debate emerging whether it is favourable to actively look beyond the sponsored deals which is a crowded space.

the non-sponsored market has some characteristics that are quite compelling; less competition, better covenants and documentations. The difficulty is sourcing the assets within private credit
Other allocators are seeking out borrowers that are not associated with private equity sponsors for other reasons
We do believe that a ”complexity premium” still exists in non-sponsored middle market borrowers, asset backed specialty finance borrowers or even large cap borrowers with eg. complex capital, complex corporate structures and need for speed and certainty of closing
Some allocators tactically increasing opportunistic distressed strategies
Some allocators, such as Evli, maintain steady weightings to both direct lending and opportunistic strategies and others such as Mandatum Asset Management, argue that it is difficult to tactically time private markets. Yet they still expect managers will be able to be opportunistic:
At specific points of the cycle, opportunistic private credit can be countercyclical in offering opportunities to take advantage of market turbulence and obtain higher returns
Others are making tactical calls, which can include reducing or holding steady direct lending in order to tactically allocate more to opportunistic strategies, such as distressed debt and special situations, which may find more opportunities in a slowing economy and a bear market for credit.
It may seem surprising to take more risk in a recession, but this is precisely when the supply of stressed and distressed debt increases, and the potential returns can be several times higher than investing in safe performing credits. Higher risk premiums for corporate credit risk attract more capital.
Most allocators are exposed to both the US and Europe. Many will hedge part or all of USD fund exposures back to home currencies, while some will access a Euro share class. The currency risk decision could be made at a different level by other teams who manage macro or global tactical asset allocation. The US has historically been a larger market for distressed debt, but some allocators are seeing strong opportunities in Europe.
4. Target Returns and Yield Pickups
Return targets range from mid single digit to mid teens
The range of target returns is fairly wide, with different allocators mentioning figures of 5%, 10% and 15% for different sub-sectors. The overall blended return targets are somewhat narrower, but still range from 6-10%.
This reflects the diverse spectrum of risk and return profiles available in the space. Plain vanilla, senior secured direct lending might only target 5% whereas more opportunistic strategies are seeking double digits.
Future returns could be higher than historical returns, with both base interest rates and credit spreads moving up:
“We believe that the vintages being now deployed should reach 2-3% higher returns than previous vintages. This is partly due to rising base rates. Interestingly we are observing 50-150bps margin increases in addition to the rising rates” – Tuomo Hietaniemi, Portfolio Manager, Private Debt Funds at Elo
Yield pickup targets range from 100 to 600 basis points
The level of yield pickup versus public credit is also subject to widely varying targets, ranging from 100 to 600 basis points.
Some allocators find it useful to look at yield pickup relative to credit ratings, and might estimate an equivalent credit rating for unrated credits. Others find it more useful to look at yield pickup per turn of leverage. And others argue that the analysis needs to be more nuanced to allow for the complexity and cyclicality of different companies and industries.
Yield pickups can be measured per turn of leverage, but this may not always be a perfect measure:
“spread per turn of leverage measures have some value, but you also need to consider that stronger businesses with more stable income can hold more debt than more cyclical businesses. A more holistic, ratings-based view can factor in all risks and mitigants, including cashflows, earnings, forecasts,” – Jimmy Lundby, Chief Portfolio Manager for Private Credit Investments at PENSAM
Yield pickups can cover at least five different sorts of risk premia
Most allocators mention one yield pickup figure for all premiums: illiquidity, complexity, sourcing, structuring, and speed of execution.
Other allocators suggest that premiums vary between strategies. As direct lending has matured some allocators argue that the premium is now mainly for illiquidity, whereas other strategies including distressed and special situations are still earning more of a premium for complexity, sourcing and structuring:

The return premium is mainly for illiquidity, and partly because the borrowers do not have a credit rating. We do not believe there is much if any complexity premium involved: These loans are not very complex and are not special situations or distressed
It is in other strategies apart from direct lending where there could be a larger premium for complexity and sourcing:

distressed networks and legal knowledge could be needed for more esoteric transactions such as secondary purchases from banks, it is a different ball game. Larger portfolios may also need servicing capabilities
Structured credit can also offer a variable yield pickup, which at certain points of the cycle could be at least as high as on private credit:

It is roughly 400-900bps in yield pickup for BBB, BB and B CLOs compared to bond equivalent
5. Liquidity, Cash Management and Secondary Markets
A conservative approach to cash management
Nearly all allocators keep short term cash within their alternative and private credit allocations (including sometimes multi-manager vehicles or funds of funds) simply in cash or short dated government bills and bonds. Some might use money market funds or liquid credit funds as well. One has identified bank accounts from smaller banks as offering competitive returns.

Bank accounts are currently more attractive. They can pay as much as EURIBOR plus 50 to 60 basis points for a 3 month deposit
Pohjantähti in Finland – is already exposed to trade finance and another – Elite Alfred Berg in Finland – is considering trade finance.
Supply chain delays and disruptions are one factor that increases the demand for supply chain finance such as insured trade finance.
We cannot extrapolate from this to the total firm level, where there will be yield enhancement cash management strategies, usually managed by a different team, separate from the specialist private and alternative credit allocators.
Allocators are sensitive to liquidity mismatch and cash drag risks in vehicles
Investors also keep an eye on cash uses and weightings in underlying vehicles. They generally allocate to private debt through closed end funds with multi-year lockups, which will often have a private equity style capital call mechanism, minimizing idle cash. Some allocators stress the need for closed end structures to avoid potential liquidity mismatches. They are aware of “hybrid” fund structures that combine elements of both open and closed end funds, but are not always confident about this being a reliable source of liquidity.

We have seen hybrid funds but they can turn out to be easy to get into but hard to get out of. The liquidation mechanisms need to be closely looked at. We have not invested in them now in private debt
Another concern about hybrid vehicle structures is that keeping cash to meet potential redemptions could dilute returns:

We are wary of return drag from liquidity features, but keep it on the radar
Allocators are aware of secondary markets and a few already use them
Secondary markets can potentially offer better liquidity prior to maturity dates in private and direct lending, both for investment vehicles and underlying private loans. All allocators are aware of secondary markets both in funds and individual private loans, and seem open minded about potentially using them, but have generally not done so yet on the private debt side.
Two allocators interviewed have actually used secondary markets in private debt:
“We find this an interesting and developing part of the PD investment universe and are active in this space” – Tuomo Hietaniemi, Portfolio Manager, Private Debt Funds at Elo
“We are not very active in the secondary market space but have taken some opportunities on the way if wide discounts have been available” – Petri Lehtola. Portfolio Manager at OP Asset Management Ltd
Others plan to use secondary markets for private debt in future:
“We might use secondary markets to increase allocations to some funds we know” – Ville Toivakainen, Investment Director for Private Assets at Evli
Co-investments
Similarly, co-investments are on the radar, even if they are not widely used.
“Co-investments into individual deals could be contemplated, but they would need to be a bit special” – Tero Pesonen, Director of Private Equity and Private Credit, at Local Tapiola Asset Management
Discount volatility a concern with publicly listed vehicles
As well as secondary markets in private funds and private debt, there are also publicly listed vehicles investing in alternative and private credit. The largest category is Business Development Companies (BDCs) listed in the US, which have existed since 1980. Allocators here need to get comfort with the extra volatility associated with a public listing.
“We invest in private funds run by managers who also have BDCs, but do not invest in BDCs due to the mark to market volatility of discounts to NAV. We would like to see robust liquidity programs to manage discount to NAV” – Cian Walsh Head of Hedge Funds and Private Debt at Formue
6. Key Risks, Fears and Opportunities
The fear of “stagflation” is stalking markets.
“The interplay between fighting rising inflation while keeping economic growth on a sensible level at the same time is something we worry about” – Hjorleifur Waagfjord, Head of Institutional Asset Management at Arion Bank
Further increases in yields are expected
Most allocators expect interest rates or credit spreads or both could rise further, which provides an opportunity to earn higher yields, but could also increase credit risk where companies cannot afford higher debt costs.
Nobody interviewed seems worried about spread recompression increasing reinvestment risk
Recession and defaults are both a risk to manage, and an opportunity
Many allocators are worried about recession, increased consumer and/or corporate defaults, and potentially lower recovery rates upon default.
“Even if floating rate investments have very low duration risk, companies and consumers may not being able to afford interest costs above a certain level. Therefore, we seek managers that have solid skills in fundamental company analysis in order to be able to minimize downside by investing in less cyclical sectors and companies” – Michael Levén, Head of Private Debt at Ericsson Pension
“So far default risk has been acceptable despite inflation rates. But if unemployment rates increase then we will see more defaults” – Jani Partanen, Chief Investment Officer & CFO at Pohjantähti
“Direct Lending funds are facing their first real market turbulence that is lasting longer (than was the case in Covid period), and central banks are not there this time (QE->QT), at least not now” – Petri Lehtola. Portfolio Manager at OP Asset Management
Even if they have not yet noticed problems in 2022, they are looking ahead to 2023.
“Our portfolio companies have proven to be surprisingly resilient until now. We do however think we are still early in this cycle and the real test is ahead of us. We should see delinquencies picking up gradually in h1/2023” – Tuomo Hietaniemi, Portfolio Manager, Private Debt Funds at Elo
Mitigating default risk
One approach is to shift towards more senior paper:
“In the end of 2022, we are in a very different environment than the beginning of the year and it is a time for caution. There has been a shift away from junior financing to more senior, secured first lien risk” – Michael Bech, Head of Private Credit at Danske Bank Asset Management
Another cautious approach is to seek less leveraged deals:
“We wanted to find managers who would do deals at lower debt levels than the market in general” – Patrik Jonsson, Head of Manager Selection Public Markets and Private Debt, AP2 Sweden
A third way to mitigate recession risk is reducing or avoiding cyclical industry exposures:
“it is also important to analyse counterparties and stay away from more cyclical businesses that may not survive” -Jimmy Lundby, Chief Portfolio Manager for Private Credit Investments at PENSAM
Managing defaults when they happen
Another approach is to embrace defaults through investing in managers who can make strong recoveries, which may involve restructurings and work outs in some cases. Many allocators want to see that managers have a track record of managing defaults, workouts, restructurings and recoveries, and will examine individual case studies, looking at court-based and out of court processes, committee memberships and so on.
Others also view defaults as a tactical opportunity for strategies such as distressed and special situations as well as private lending. If some firms are shut out of public markets and cannot refinance, private lenders may be able to demand higher yields and better terms.
Liquidity Risk
Liquidity risk associated and central bank quantitative tightening (QT) are concerns for some, but the other side of this risk is that less liquid markets can allow longer term investors to earn more premiums.
Other Risk Factors
In the other category, three allocators each identified other factors: the Russian war; energy prices and the drought in Europe, and the next wave of AIFMD regulations.
7. ESG Requirements
We have not noticed a change in ESG policies in response to Russia’s invasion of Ukraine. This is partly because policies were anyway quite nuanced. For instance, it is unusual to see any and all forms of weapons excluded. It is much more common to see “controversial weapons” including nuclear, land mines, and cluster munitions excluded.
Allocators’ ESG criteria are not easily standardized or generalized
ESG requirements can range from wanting asset managers to be UNPRI signatories, to proprietary questionnaires of 100 or more questions, which may also contribute to proprietary scores and ratings.

Among other things, our annual ESG questionnaire asks managers for sustainability and ESG scores or ratings, carbon footprints, exclusion criteria and lists, engagement case studies and statistics, impact metrics and data, material incidents, and alignment of investments and revenues with the EU taxonomy
“Managers generally need to have a minimum overall ESG score for us to invest in them. If they fall short, we sometimes suggest the manager to make improvements after which we will make a new evaluation” -Michael Levén, Head of Private Debt at Ericsson Pension
Some allocators also negotiate side letters specifying their reporting requirements.
Some managers have a more quantitative approach while others are more qualitatively looking at corporate culture, DNA and wanting to see ESG integrated into portfolio and risk management processes.
Alternative and private debt data challenges
“It is relatively difficult to get quantitative ESG data from many private debt funds” – Eveliina Nyandoto, Portfolio Manager at Church Pension Fund, Finland
Even where the data exists, it is not always being reported on a common and consistent basis, and there are high hopes for harmonization.
“we would like to see better reporting, especially for alternative credit. We are seeing some improvement but harmonization remains a concern. Some firms report carbon emissions by end use and others do it by enterprise value. We cannot easily compare the two” – Toni Iivonen, Chief Investment Officer of Elite Alfred Berg (EAB)
“For a portfolio manager, it is a nightmare to get 30 or 50 differently categorized ESG reports. Now you are adding apples and oranges and bananas together and trying to figure out the development on your portfolio level” – Tuomo Hietaniemi, Portfolio Manager, Private Debt Funds at Elo
ESG criteria can be sensitive to manager locations and fund domiciles
ESG policies are also sensitive to geographic differences: US managers are perceived to be stronger on the ‘S’ side while European managers place more emphasis on the ‘E’ side. Reporting on managers’ DEI (Diversity, Equity and Inclusion) is seen as relatively easy while carbon reporting is a more complicated task. Many US managers have a DEI committee in their firms.
Some allocators, including some outside the EU eg in Norway and Iceland as well as Ericsson pension in Sweden, argue that SFDR is not relevant to some offshore funds.
Allocators are not yet insisting on SFDR 8, but may do in future
But most managers are allocating to strategies making disclosures under SFDR category 6 and 8. There is a common expectation that many managers currently under 6 will migrate to 8, that 8 is already standard for some strategies, and that it will will become standard in Europe.
“Disclosures under SFDR 8 are now the norm for European direct lending”– Jussi Tanninen, Head of Private Debt and Real Estate at Mandatum Asset Management
“The category 6 ones are expected to migrate to category 8 in due course,” – Mikael Huldt, Head of Alternative Investments at Afa Försäkring
“In traditional fixed income, nearly all of our funds are article 8 (82%) and article 9 (9%). In private debt, only 15% are article 8 and 12% are article 9, but this could change in future: We expect the number of article 8 and 9 funds to go up in the coming years”– Eveliina Nyandoto, Portfolio Manager at Church Pension Fund, Finland
Some allocators suggest that direct lending funds are more likely to be 8 while opportunistic strategies are more often 6, to maximise their potential to take advantage of special situations that could occur in some controversial industries that might – either now or in future –not be a good match for SFDR 8.
Multi-manager programs’ SFDR categories
There are different opinions about whether and to what extent multi-manager programs’ SFDR categories need to correspond with those of their underlying funds. Since reporting under 8 is far from universal, some multi-manager programs are currently staying under 6 to maximise their investment universe. In contrast, one multi-manager program making disclosures under 8, claim that they can still allocate to managers under 6 providing there is a side agreement on reporting.
“We can however still invest in some article 6 funds, so long as there are separate agreements on article 8 reporting requirements.” – Michael Bech, Head of Private Credit at Danske Bank Asset Management
Impact investing is slowly growing but not all allocators have exposure to it or SFDR 9 funds
Some asset owners are using private debt SFDR 9 funds as an important part of their impact investing allocation. Others view it as more of an optional extra.
“Article 9 is nice to have, but not a must have for impact strategies. It can be difficult to navigate whether they are inside or outside the Article 9 rules” – Mikael Huldt, Head of Alternative Investments at Afa Försäkring
Some allocators question how aggressively private debt funds can pursue impact investing, because private debt managers do not have as much influence on investee companies as private equity managers.
“Private debt funds generally have less influence than PE managers on a company’s ESG agenda since they do not control the companies” – Michael Levén, Head of Private Debt at Ericsson Pension
Most allocators are only aware of a small number of funds making disclosures under SFDR 9, some say they cannot find any, and many do not yet have any exposure. It may be too early to form a full view on article 9, since the rules are still developing
“For article 9 products we expect to see some adjustments as the level two reporting requirements come into effect next year,” – Petri Lehtola. Portfolio Manager at OP Asset Management
Separate vehicles or part of mainstream direct lending?
Some allocators argue that a separate investment vehicle should be set up to pursue impact investing goals.
“if we wanted to pursue impact investing through credit, we would launch a separate fund of funds vehicle” – Tero Pesonen, Director of Private Equity and Private Credit at Local Tapiola Asset Management
Another view is that mainstream direct lending could start to incorporate some impact elements. Regardless of SFDR categories, one example of an impact investing feature of some debt instruments is “sustainability linked ratchets”. These vary borrowers’ yields according to ESG KPIs, so that borrowers improving their ESG performance can pay lower interest rates. These are becoming much more common in Europe.
“Even in US we are starting to see sustainability linked loans where KPIs like carbon emissions or water consumption metrics can lead to lower or higher interest costs. In Europe, most new loans have some ESG margin ratchets” – Ville Toivakainen, Investment Director for Private Assets at Evli
However, as with many areas of ESG there are differences of opinion, and not all allocators are fans of the ratchets:
”ESG ratchets are becoming more common with lower rates being offered to companies for certain projects. But my question is always if these are things that companies should be doing anyway and you just end up giving up returns?” -Patrik Jonsson, Head of Manager Selection Public Markets and Private Debt, AP2, Sweden.
8. Manager Selection and Due Diligence
The length of due diligence processes ranges from about 4 weeks to about 6 months. It will often be faster for a new fund from an existing manager, than it would be for a new manager.
Due diligence is done mainly in house, except for tax and legal
Most Nordic allocators are taking external advice on tax and legal matters, but doing other due diligence in house. There are a few exceptions where either tax or legal DD or both can be partly or wholly done in house. Some might occasionally outsource operational due diligence for managers located far away. Only two allocators interviewed is using consultants to help with manager searches.
Networking is most important for sourcing funds
Personal and professional networks are the biggest source of idea generation for sourcing managers. Conferences, third party marketers and media can also be important. Capital introductions and databases are less important.
Everyone meets new managers but criteria for track records will vary
Allocators have between 75 and 300 manager meetings per year. A minority of these are with new managers. Correspondingly, the majority of investments are with existing managers.
Few allocators set a minimum number of years’ track record for new managers, but they do define it more qualitatively. Managers need to demonstrate experience of surviving through at least one crisis period, and ideally several.
Most allocators are seeking funds running over a billion
Some allocators are mainly invested with managers running 1 to 5 billion, and this is partly because their ticket size and ceiling on share of a vehicle sets minimums at this level. For instance, if an allocator is investing 100 million and cannot be more than 10% of a fund, that sets an effective minimum of 1 billion.
A small number of allocators set much lower minimums or none at all. The lowest minimum fund sizes specified were EUR 20 million by Church of Finland pension fund, and EUR 50 million by Elite Alfred Berg in Finland.
The most common ceiling for share of a vehicle is 10%, though some managers can go as high as 20% or even 25% for a UCITS and one mentioned 30%. However, they do not expect to come close to these maximums.
Nearly all allocators are in comingled funds, though a few may do separately managed accounts. The choice between the two partly depends on the timeframes, since the due diligence process for setting up an SMA tends to be longer. The size of allocations is also relevant: there is a minimum level of assets to make an SMA worthwhile, for both allocators and managers.
A few allocators avoid offshore domiciles but most invest onshore and offshore
Most allocators will invest in offshore and onshore domiciles and have no preferences between them. One allocator argues that offshore Cayman funds have lower costs and more flexibility than onshore funds. A few allocators raise concerns about some offshore domiciles,
“we are sensitive to the tax haven perception of offshore jurisdictions” – Michael Bech, Head of Private Credit at Danske Bank Asset Management
The most common restriction is to avoid domiciles on the EU list of “non-cooperative jurisdictions”.
Ireland and Luxembourg are most often mentioned as domiciles.
9. Contacts
If you have questions about this report please contact:
Jonas Wäingelin, Editor in Chief, NordicInvestor,
jonas@nordic-am.com
+31 (0) 642 516 777
For more content around and about the nordic asset management space, please visit our main site here
Disclaimer
The information in this document has been compiled by NordicInvestor B.V. It is produced for private information of recipients and NordicInvestor is not soliciting any action based upon it. All information has been compiled in good faith from sources believed to be reliable. However, no representation or warranty, expressed or implied, is made with respect to the completeness or accuracy of its contents and the information is not to be relied upon as authoritative. Recipients are urged to base any investment decisions upon such investigations as they deem necessarily. To the extent permitted by applicable law, no liability whatsoever is accepted for any direct or indirect loss arising from the use of this document or its content. Your attention is drawn to the fact that NordicInvestor, or any entity associated with NordicInvestor or its affiliates, officers, directors, employees or shareholders of such members may from time to time have holdings in the securities mentioned herein.
Confidentiality Notice
This report is confidential and may not be reproduced or redistributed to any person other than its recipient from the publisher. NordicInvestor B.V, 2022. All rights reserved.